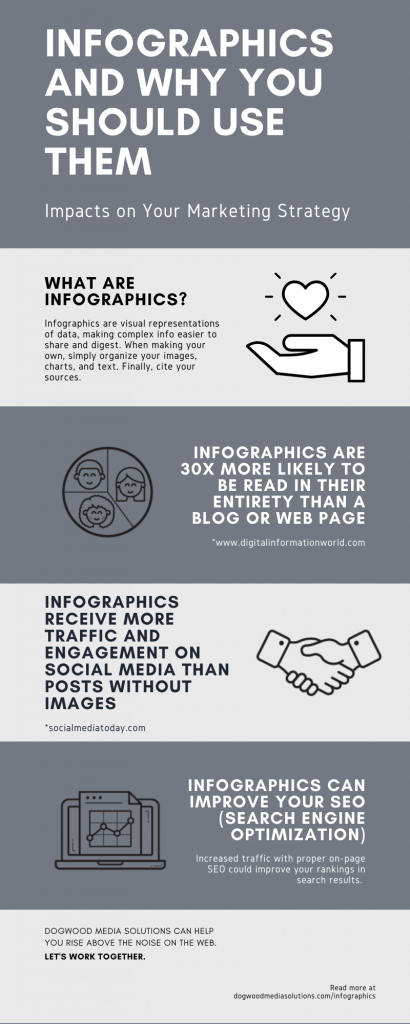
Are infographics part of your marketing strategy? If not, they should be! Many business owners struggle when it comes to images and graphics to share on social media posts, web pages, or blog posts. In today’s blog, we are talking all about infographics and why you should include them in your digital marketing strategy.
What are Infographics and Why Should You Use Them?
Infographics contain key points of data that you are including in the content of your webpage, blog, or social media post. You already have the key points in front of you so taking a little extra time to create an eye-catching visual of that information will be well worth it.
To put it simply, infographics are “informational graphics.” They are a visual way of telling a story. Since humans process visuals 60,000 times faster than text, people are more likely to absorb information from a graphic over lines of text. Our brains can absorb many facets of information simultaneously from an image whereas lines of text can only be absorbed in a linear fashion.

The Impact of Infographics and Your Digital Marketing Strategy
Infographics show 12% more views and 200% more shares than posts without images. We are a highly visual culture. Social media posts that include images (infographics included) show increased engagement across all platforms. The bottom line is that you need to include a visual with your posts. Infographics should be a part of those images.
Infographics can boost your SEO rankings. While infographics themselves are not a ranking factor for SEO, the increased clicks and shares you receive signals to search engines that you have relevant content and can improve your rankings. Be sure to have on-page SEO on the blog post or website and include your keywords or phrases in the alternative text of the infographic.
Infographics are 30 times more likely to be read in their entirety than a blog post or web page. Make sure your audience has the information you want them to know in an infographic!
How to Create Quality Infographics
“The most challenging aspect of infographic design is finding the perfect balance between visual appeal and accessible information. While the graphic needs to be eye-catching and interesting to look at, it’s easy to over-design to the point where the information you were hoping to present is no longer easy to read. In the same way, an infographic that’s overly text-heavy and cluttered will not look interesting or appealing enough to hold anyone’s attention long enough to process the information. The best infographics embrace the visual element of the design without sacrificing the messaging.” – Kristen Wallace, Graphic Designer
Before you begin your actual design process, you need to determine the type of infographic that best fits the type of information you want to share. Most infographics fall into the following categories:
- Lists – List the ways your product, service, or mission impacts the world.
- Comparisons- Compare your product and service to another.
- Timelines – Show how your company has grown over time.
- Processes – Show your audience how your product, service, or mission happens.
- Geographical – Show the areas your product, service, or mission impacts.
- Statistical – Show the data that correlates with your business.
- Hierarchical – Show how the impact of your product, service, or mission impacts multiple levels of people.
Once you have decided the type of infographic you want to share then you need to organize your information. Keep it short. Keep it precise and keep it clear. Readers like infographics because they are not overwhelmed with information.
Create your design! Consider your branding guidelines and include your logo there if applicable. Make sure the colors and graphic icons you choose correlate and are not overwhelming the text.
- Be sure your content includes:
- A strong call to action in your infographic.
- Citations in your infographic when applicable. Share great information that you found on the web, but give credit where credit is due!
Don’t be intimidated by the thought of creating great-looking infographics yourself. There are a number of sites out there that offer professional-looking templates for free or for a small fee. The infographic included in this post is one that I designed using a free Canva template. In the “Create a Design” menu I chose “infographic.” I then chose a layout that corresponded to the information I wanted to include and tweaked the colors to what I wanted.
Finally, Share your infographics across all platforms! Be sure to include social media shareable links on a blog or webpage. Make it easy for your audience to spread the word!
Contact Dogwood Media Solutions for Your Marketing Needs
The crew at Dogwood can help you with all aspects of digital marketing. We have an in-house graphic design team that can create quality infographics and anything else for your website and social media, as well as a team of digital media specialists who can handle all of your social media content and posts. Our blog writers create fresh relevant content to share on your blogs and our website developers can help refresh your website or create a new one! Contact us today to get started!


